Documentation menu
Developer guides
Ola Maps Style Editor
A style editor is a tool that allows users to design and modify the visual appearance of map layers without needing to write code manually. It provides a graphical interface to customize map styles, such as colors, labels, borders, icons, and more. The styles created in the editor define how map data is rendered when displayed to users. Most style editors are built for maps that use vector tiles, and they work by creating or modifying JSON files (often called style.json), which hold all the style information. The output styles can be used in various map frameworks like MapLibre, Mapbox GL, or custom map servers.
Key Features of the Style Editor
- Interactive Map Styling: Users can directly change the look of the map by adjusting the visual aspects such as fonts, colors, borders, and labels. The changes are previewed in real time on the map.
- Layer Management: Style editors allow users to manage multiple layers. Each layer can represent a different type of map data, such as roads, water, buildings, or points of interest (POIs). You can control the appearance of each layer independently.
- Zoom-Level Adjustments: Control the visibility of features based on zoom levels (e.g., show country borders at zoom level 3 and city names at zoom level 12).
Customization of Styles
The style editor allows extensive customization of maps:
- Colors: Users can change the colors of various map features, like roads, water bodies, and parks. Different hues can be assigned based on use cases such as political maps, navigation maps, or topographic maps.
- Labels and Text: Customize the appearance, font, and size of labels for cities, countries, or landmarks. You can also adjust the language or customize the text placement for better readability.
- Visibility Controls: Show or hide certain layers depending on zoom level. For example, you can make fine details like street names appear only when zoomed in close enough, while larger regions like countries or cities appear at wider zooms.
Use Cases of Style Editors
Style editors serve various purposes across industries:
- Custom Maps for Websites or Apps: Businesses can create branded maps for their applications, changing map themes to match their corporate colors.
Using the Style Editor – A Step-by-Step Guide
1. Accessing the Style Editor
To get started, follow these steps: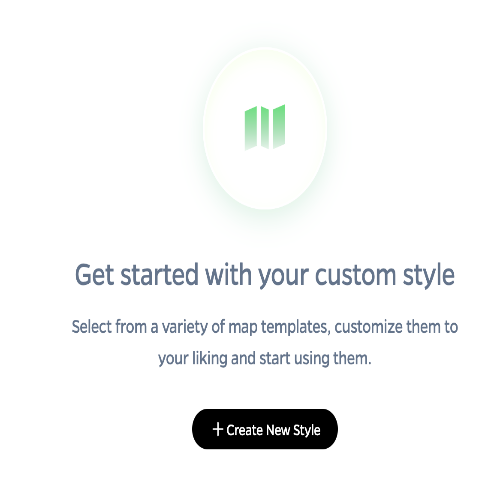
- Click on the Maps Section on the side bar and click on Map Studio
- You will land on the introductory page with a brief overview of the Style Editor.
- Click the "Create New Style" button to proceed.
2. Choosing Your Template
On the next page, you will be prompted to select a template for your map style. We offer two predefined options to get you started: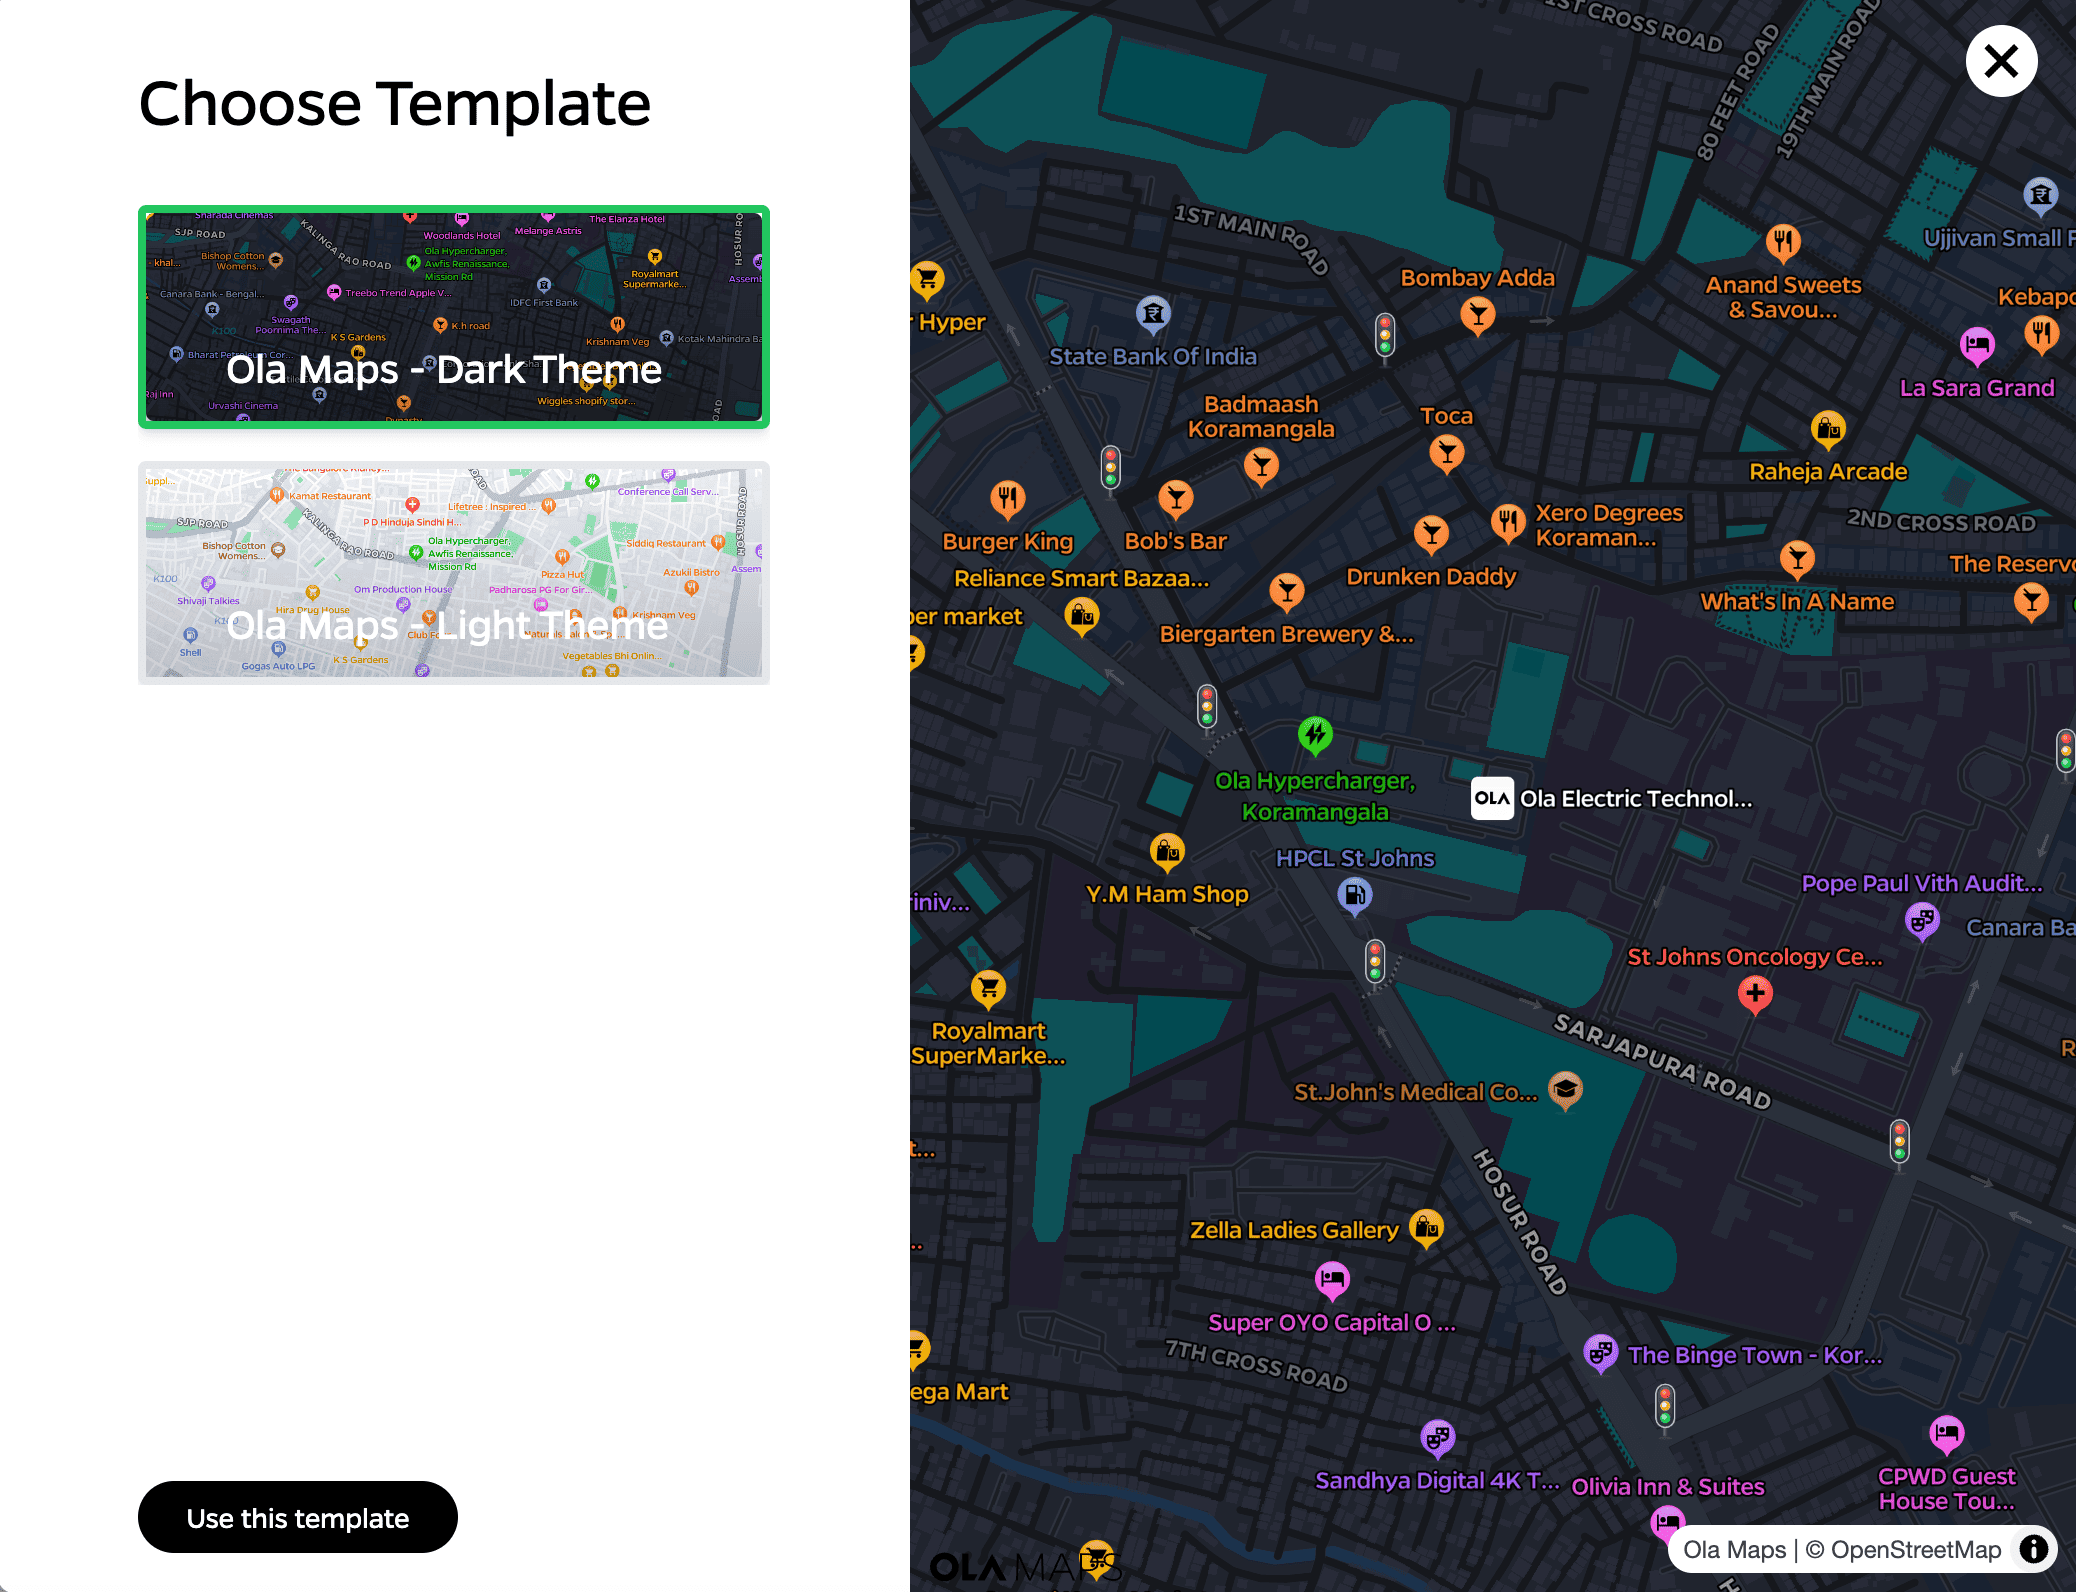 These templates provide a base style for your map, which you can fully customize in the Style Editor. Once you've chosen your template:
Click the "Use this Template" button to move forward to the main Style Editor interface.
- Ola Maps - Light Theme
- Ola Maps - Dark Theme
3. Navigating the Style Editor Interface
Once inside the Style Editor, you'll notice a layout designed to streamline the customization process: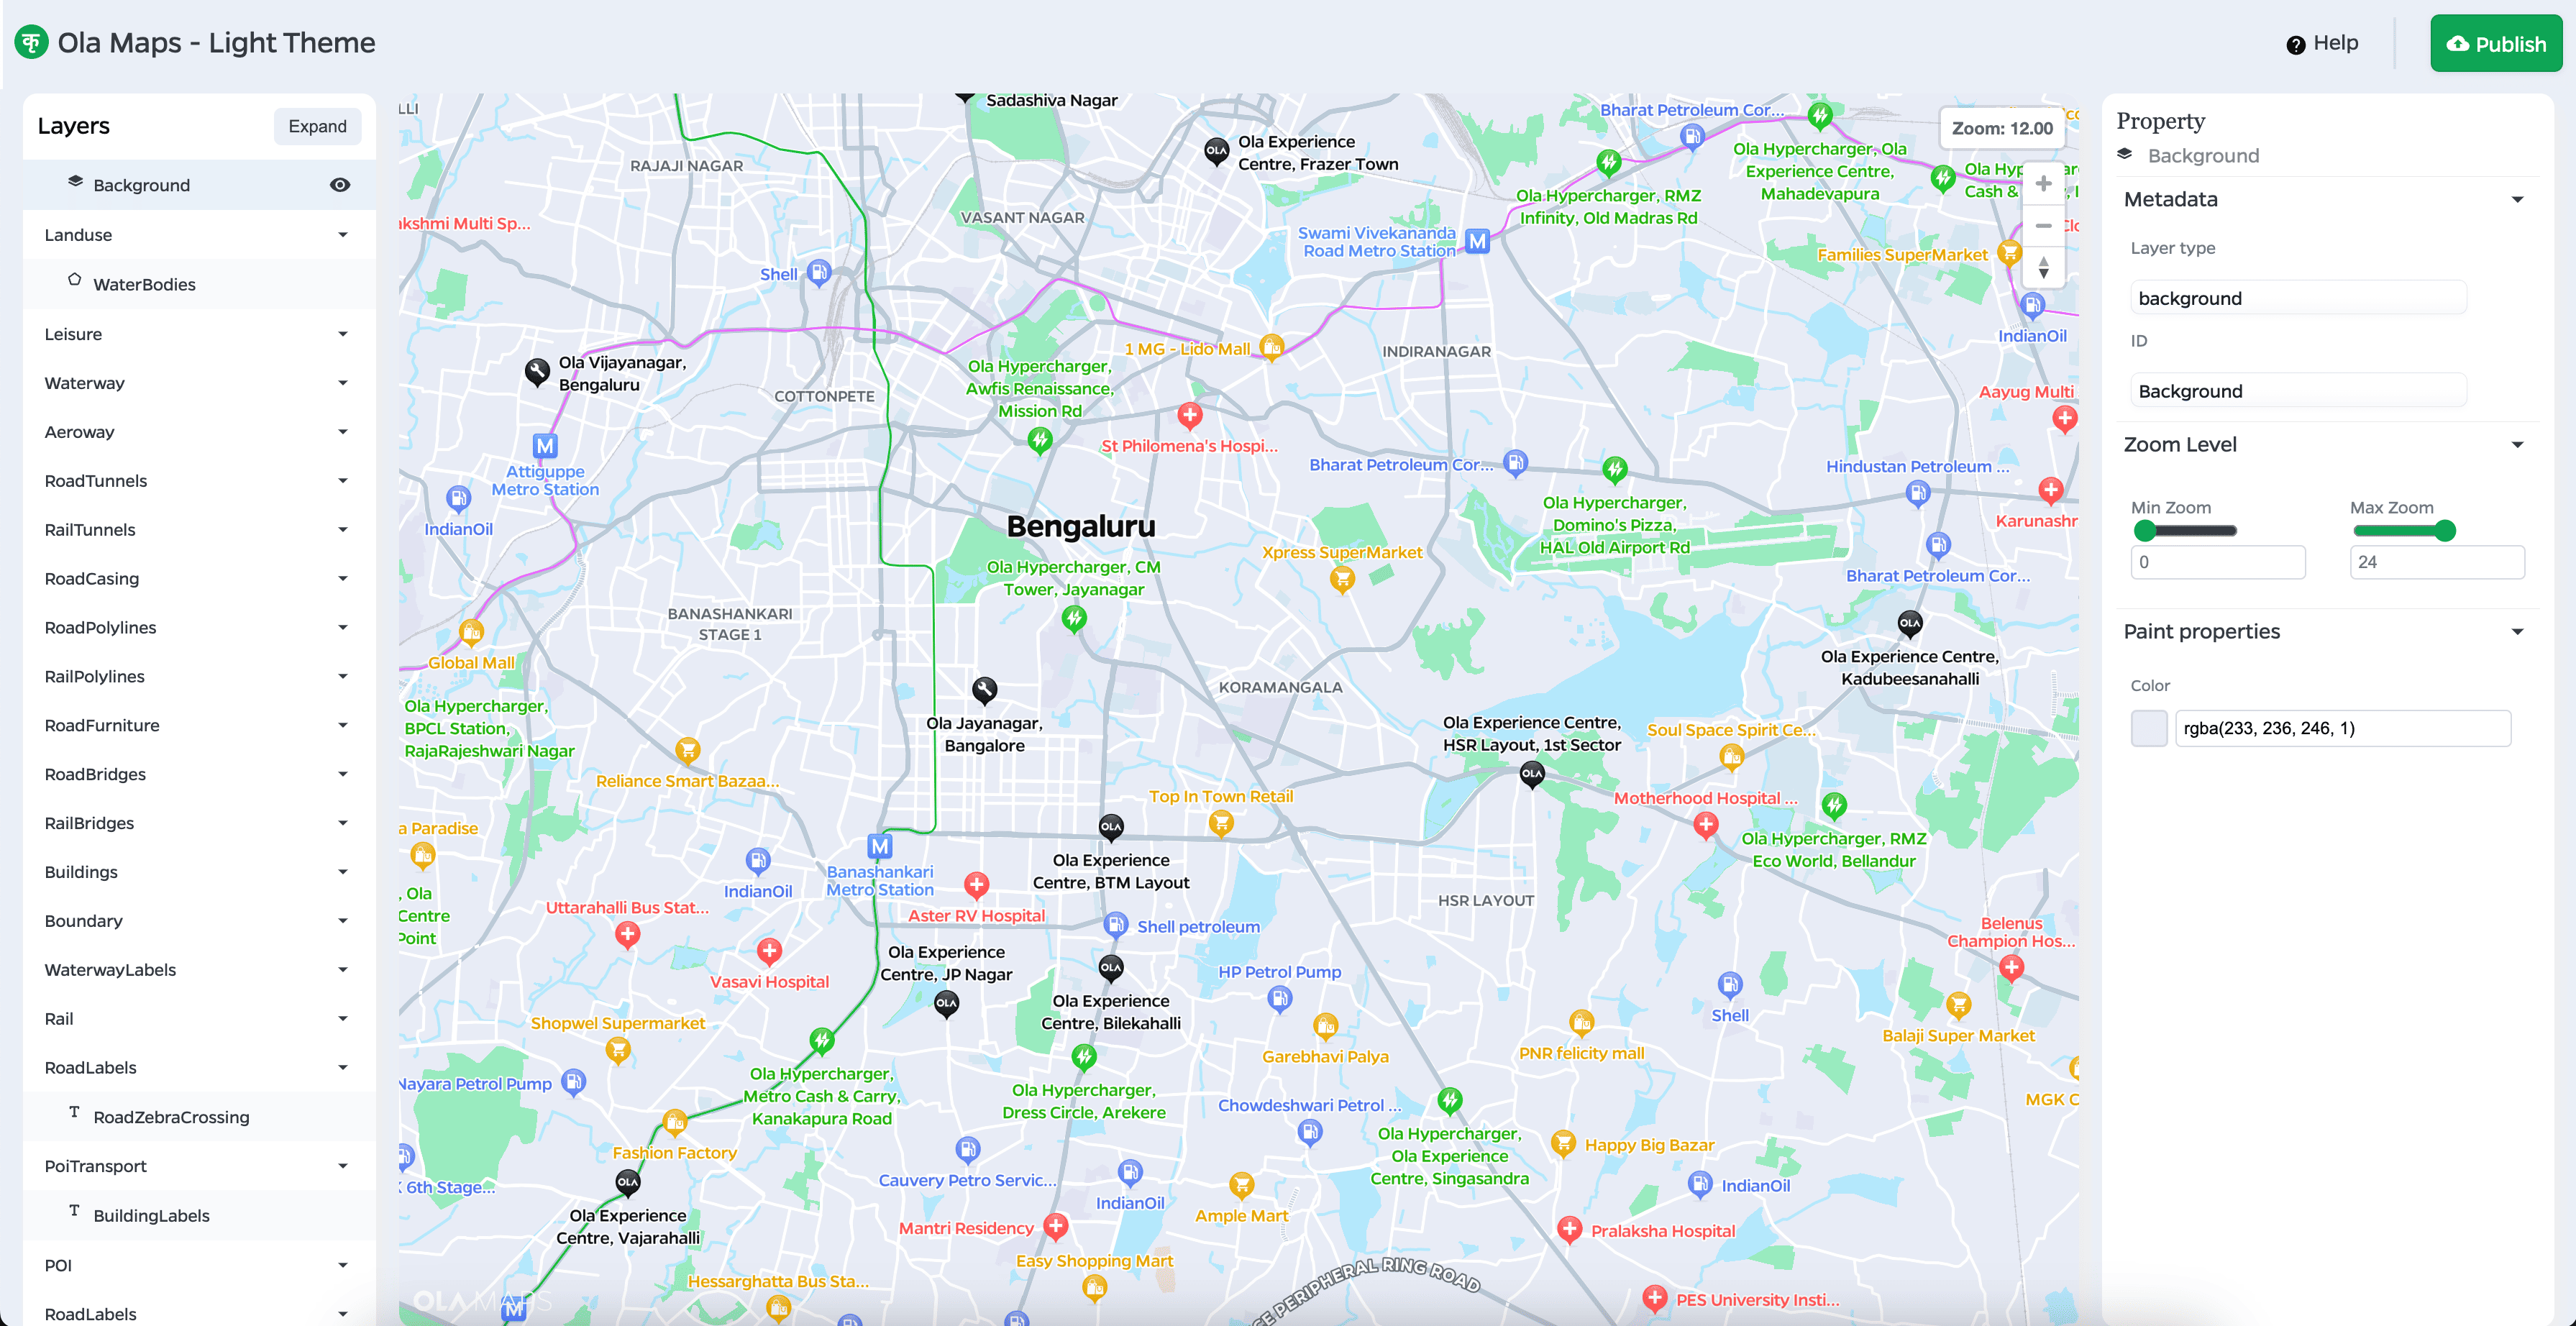
- Map View (Center Panel): The map is displayed at the center of the screen, showing the current style and all the features ready for customization.
- Layers Panel (Left-Side Panel): This is where you can see all the layers in your map, such as roads, water, buildings, etc. Layers are the building blocks of your map, and each one can be individually styled.
- Properties Panel (Right-Side Panel): When you click on a layer from the Layers Panel, the properties of that layer will appear here. This panel allows you to adjust various settings like color and visibility.
4. Customizing Layers
You can modify the following aspects for each layer:
- Visibility: Toggle the visibility of each layer to show or hide specific map features. This is useful for simplifying your map or highlighting particular details.
- Paint Properties: Change the color of the selected layer. This applies to all features that use color, such as land, water, and roads.
- Text-Size Property: Change the size of the text, ranging from [0 - infinity].
As you make changes to these properties, the map in the center of the page will update in real-time, allowing you to instantly preview your edits.
5. Saving and Publishing Your Style
At the top right of the page, you'll find two key buttons: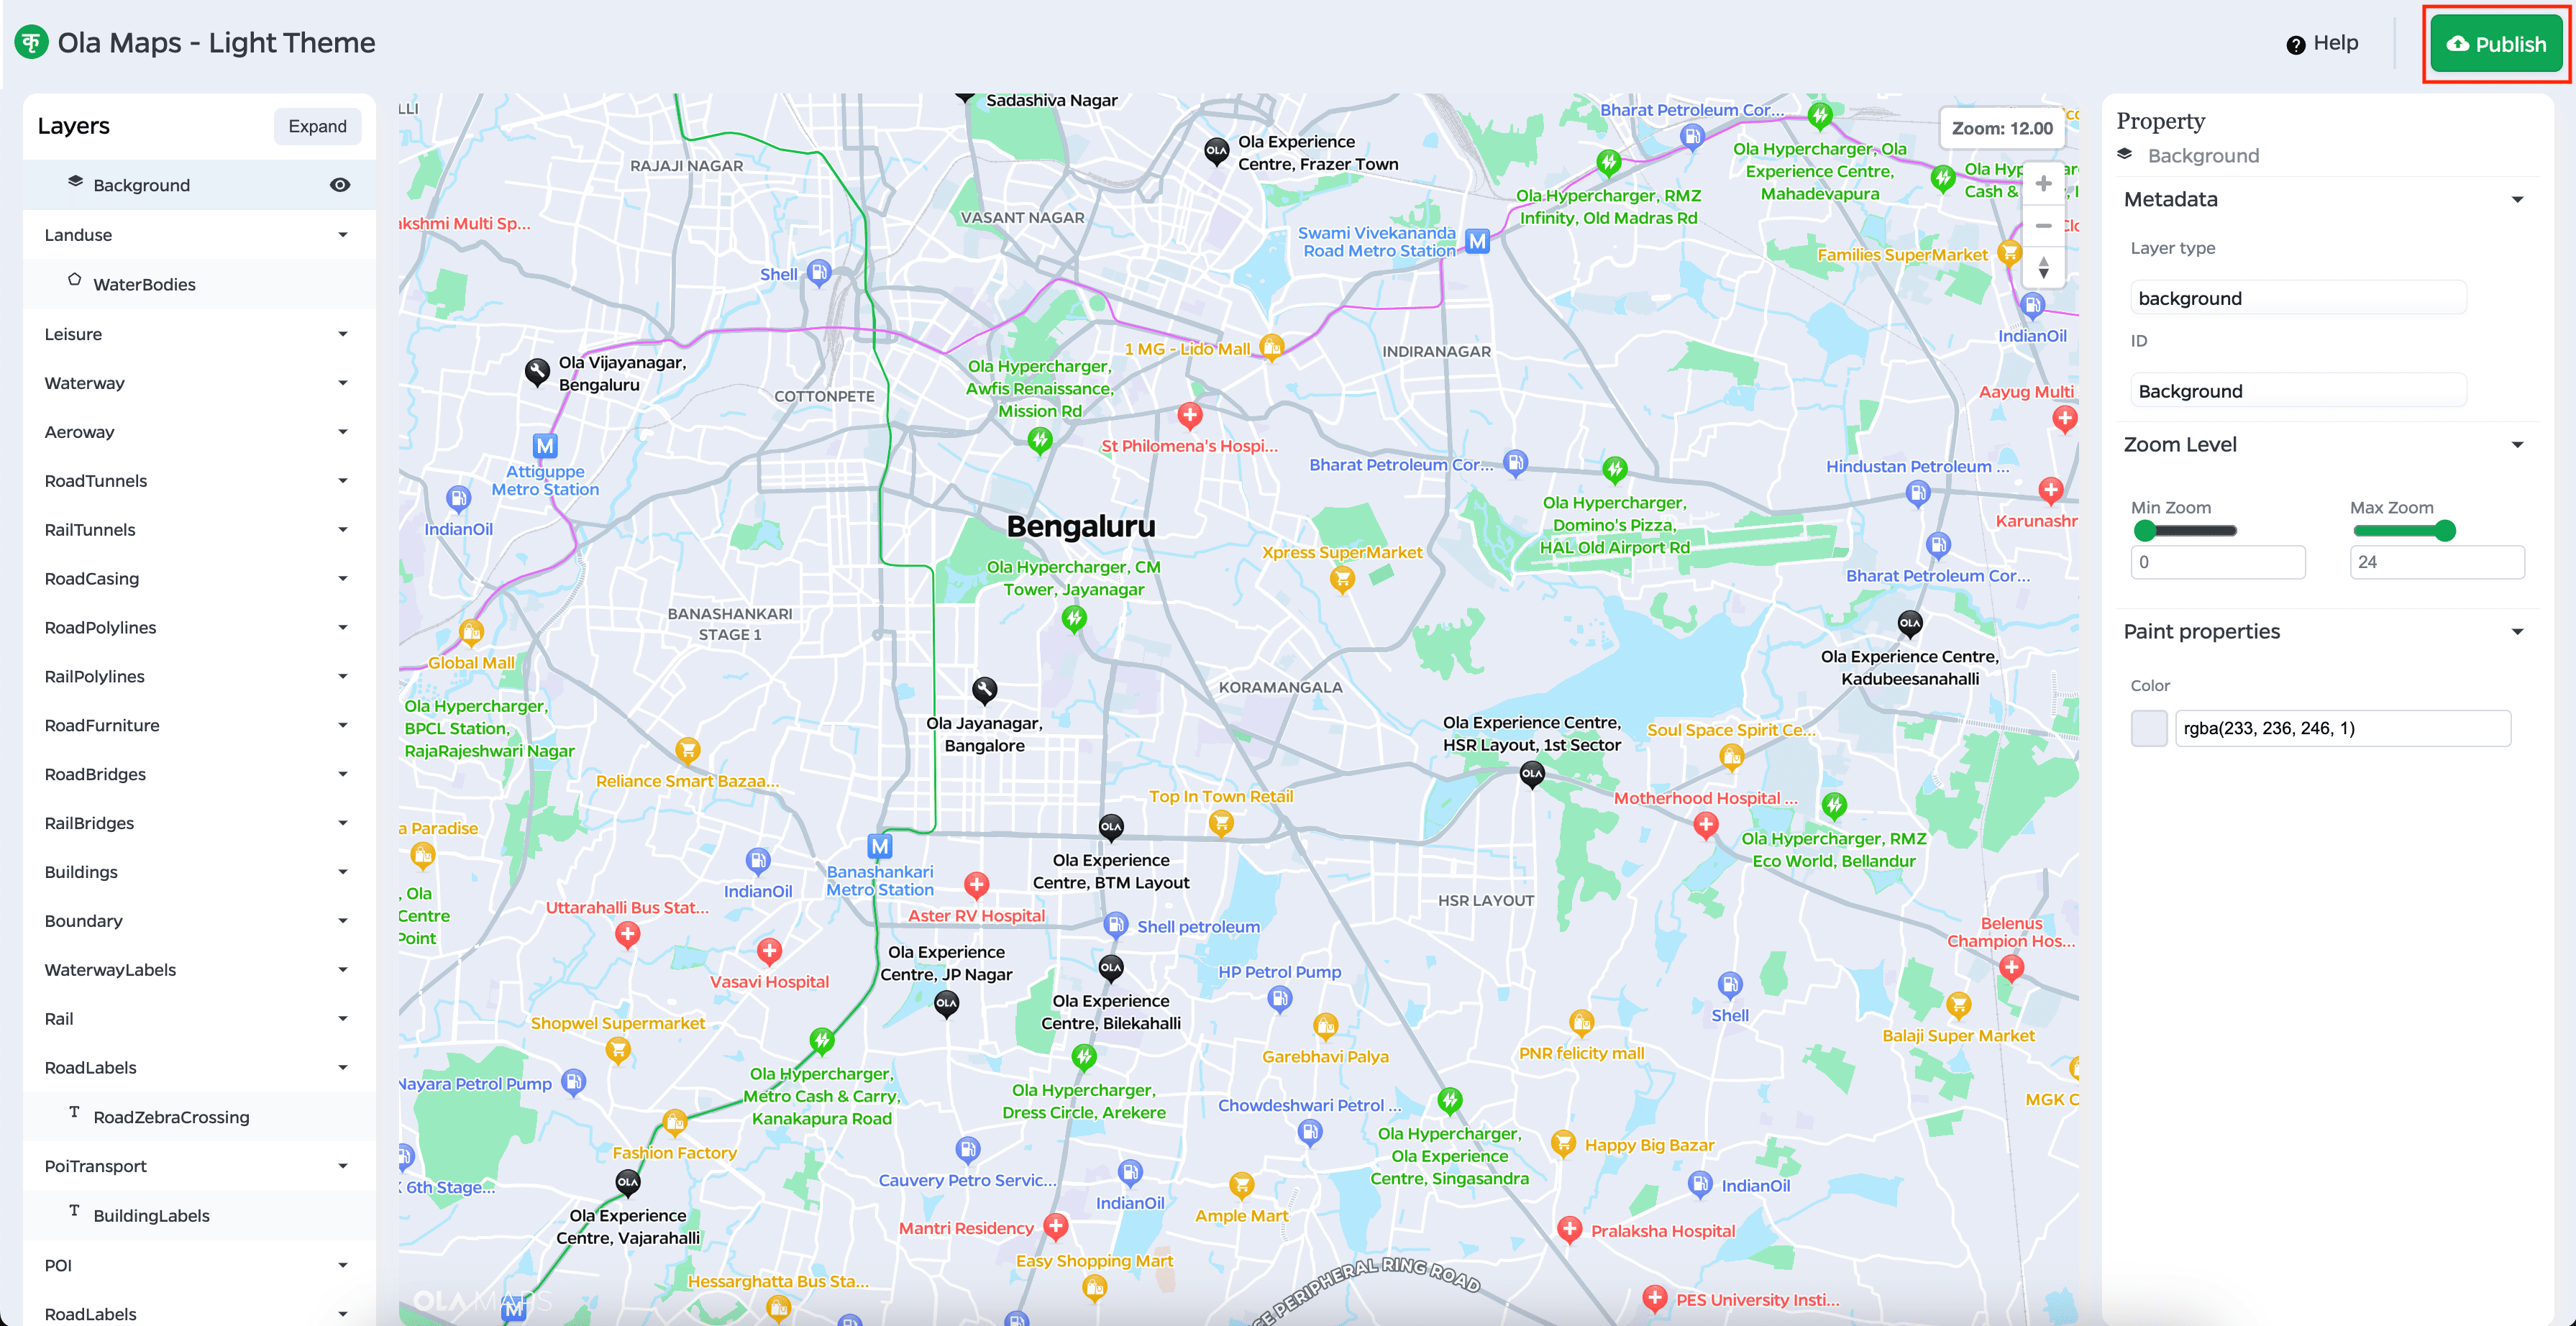
- Publish: Once you are satisfied with your style, click the Publish button on the top right corner. This will store your custom style in the "Your Styles" section, accessible from the home page. Your style can then be applied to maps across the platform.
- Save: The Save button is initially disabled when you start editing. As you publish your changes, it will become active, allowing you to save your work at any point.
Example 1: Changing the Color for Water Bodies
Objective:
Modify the color of all water bodies (e.g., oceans, rivers, lakes) to create a visually distinct and customized map style.Steps:
Access the Layer Panel:
- On the left-side panel, locate the Water layer. This layer represents all water bodies on the map.
Select the Water Layer:
- Click on the Water layer to open its properties on the right-hand side of the screen in the Properties Panel.
Adjust the Paint Property:
- In the Paint section of the Properties Panel, you will find the Fill Color property, which controls the color of the water bodies.
- Click on the current color swatch, and a color picker will appear. Choose a new color that better suits your map style. For instance, select a deep blue
(#0077b6)to represent water more vividly.
Real-time Preview:
- As you select the new color, the changes will automatically reflect on the map in real-time, allowing you to preview the updated water color.
Save Changes:
- Once you’re satisfied with the new water color, click the Save button in the top-right ribbon to store the updated style.
- If this is your first edit, the Save button will be activated, and you can then save your progress.
Outcome:
All water bodies on the map will now display in the chosen color, as was desired by the user.
Example 2: Adjusting the Color of Roads
Objective:
Modify the color of all major roads (primary and trunk roads) of the city to create a visually distinct and customized map style.Steps:
The steps for this layer will be a little different. The user has to navigate to the
road_trunk_primary layer to change the color of that specific road layer.Access the Layer Panel:
- On the left-side panel, locate the
road_primary_trunklayer. This layer represents the trunk and primary roads of a city.
- On the left-side panel, locate the
Select the Roads Layer:
- Click on the Roads layer to open the detailed properties for roads on the right-hand side in the Properties Panel.
Adjust the Paint Property:
- In the Paint section of the Properties Panel, you will find the Fill Color property, which controls the color of the roads.
- Click on the current color swatch, and a color picker will appear. Choose a new color that better suits your map style. For instance, select
(#A57B5B)to represent the roads in a dark brown color.
Real-time Preview:
- As you select the new color, the changes will automatically reflect on the map in real-time, allowing you to preview the updated road color.
Save and Publish:
- Once you're satisfied with the new road color, click the Save button in the top-right ribbon to store the updated style.
- If this is your first edit, the Save button will be activated, and you can then save your progress.
Outcome:
All the major roads of the city on the map will now display in the chosen color, enhancing the overall visual contrast and clarity of the map.
Data and Style Specification Details
There are a few important things to keep in mind when working with different properties and zoom levels in the Style Editor.
Text-Size Property
The “Text Size” property values range from
[0-infinity] using which one can adjust the size of the text.Zoom Level Constraints for Data
The Style Editor offers the flexibility to set zoom levels for your layers between 0z and 24z. However, certain data sources come with predefined zoom level limits, which take priority over your style's zoom settings. If the "source-layer"in the metadata of your style layer is linked to one of these datasets, the data's minimum and maximum zoom levels will override the style layer's zoom settings.
For instance, layers like aerodrome_label are only visible between zoom levels 6 and 14, while water can be visible from zoom levels 0 to 14. When working with these datasets, it's essential to consider the data zoom levels to ensure your custom styles align with how and when the data will appear.
By keeping these zoom constraints in mind, you'll be able to style your map effectively, ensuring that the right data is displayed at the appropriate zoom levels.
| Source Layers | MinZoom | MaxZoom |
|---|---|---|
| aerodrome_label | 6 | 14 |
| aeroway | 10 | 14 |
| boundary | 0 | 14 |
| building | 13 | 14 |
| landcover | 3 | 14 |
| landuse | 4 | 14 |
| mountain_peak | 7 | 14 |
| park | 4 | 14 |
| place | 1 | 14 |
| poi | 12 | 14 |
| road_furniture | 11 | 14 |
| transit | 8 | 14 |
| transportation | 4 | 14 |
| transportation_name | 6 | 14 |
| water | 0 | 14 |
| water_name | 9 | 14 |
| waterway | 6 | 14 |
Style Layer Ordering
The individual map default theme styles contain a collection of style layers. Layers are specified in your style JSON and are drawn in order. This means that the first layer defined in the style JSON will be drawn first and will appear below all layers that follow. The last layer defined in the style JSON will be drawn last, on top of all other layers.
You can increase the chances that a layer's labels will be visible by placing that layer further down in your style JSON.
Do keep in mind, messing up the layer order can hide important and relevant features.
You can increase the chances that a layer's labels will be visible by placing that layer further down in your style JSON.
Do keep in mind, messing up the layer order can hide important and relevant features.